Ilgmars Eglitis
1992, Dr.phys.
Telephone(s) +37128763738
E-mail ilgmars@latnet.lv
Work experience
Head of the Baldone Astrophysical observatory
2010 – 2018 Director of the Institute of Astronomy, University of Latvia
1997 – present Leading researcher
1987 – 1997 Senior researcher
1974 – 1987 Lab. and junior researcher
Main activities and responsibilities Spectrophotometry of late star and astrometry of Solar system small bodies
This is part 8 of an 8 part session series on Star Evolution. Find Part 1 here.
By watching a presentation students get the information about stages of stellar evolution. Then using the computer animation students explore the changes of stellar parameters during different stages of stellar evolution. Finally they draw a schematic diagram of stellar evolution.
Age Range: 14 – 17 years Prep. Time: 5 mins Lesson Time: 45 mins Cost per activity: Printing of student’s worksheets Includes the use of: Computer for each group of students
This is part 4 of an 8 part session series on Star Evolution. Find Part 1 here.
By using computer animation students get knowledge about different spectral classes of stars and typical spectral lines of each spectral class. Then they explore the picture of real stellar spectra.
Age Range: 14 – 17 years Prep. Time: Zero, if Activity 2 is done before Lesson Time: 35 mins Cost per activity: Printing of student’s worksheets Includes the use of: Computer for each group of students
“Stars are much like humans. They are born, live their lives and die.” Ilgmars Eglitis, astronomer
Observing the spectra of stars allows us to look deep into their origin and characteristics. A large catalog of star spectra exists at Baldone Observatory in Latvia, which is being made available online this year.
In the picture above, each horizontal “line” is the raw spectrum of one star. These are investigated with simple graphical tools, allowing us to determine each stars characteristics, origin and evolutionary state.
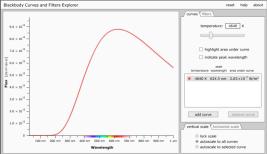
More educational material will appear on these pages over time. So far, you can play with this Black Body radiation calculator.
Baldone observatory, LatviaA lot of details are hidden in the spectra of stars. To study them, even using just a fraction of the techniques and theory available to professional astronomers, allows us to identify the spectral type of stars, their current age and evolutionary state. For simplicity, we model stars as being Black Bodies, so simulations like this can help us understand the light output of stars of different temperatures.
Black body radiation spectrum generated using the online simulator.
The user interface from the online simulator.
Stars are born in huge clouds of gas and dust, such as those seen below in images obtained from the Faulkes Telescope Project.
The star formation region NGC 3372, imaged by a 0.4m telescope in the LCO global network.
Star formation region M16, (Eagle Nebula), obtained with the 2m FT North telescope, operated by Las Cumbres Observatory.
Stars can die in a number of ways, but the more massive stars (maybe those 10 times or more massive than our Sun) explode in spectacular supernovae, such as those seen in the images below.
Image of supernova SN2011dh in the spiral galaxy M51 (the Whirlpool Galaxy).
A part of NGC 6992 (Veil nebula), a supernova remnant.


